Examples and code snippets
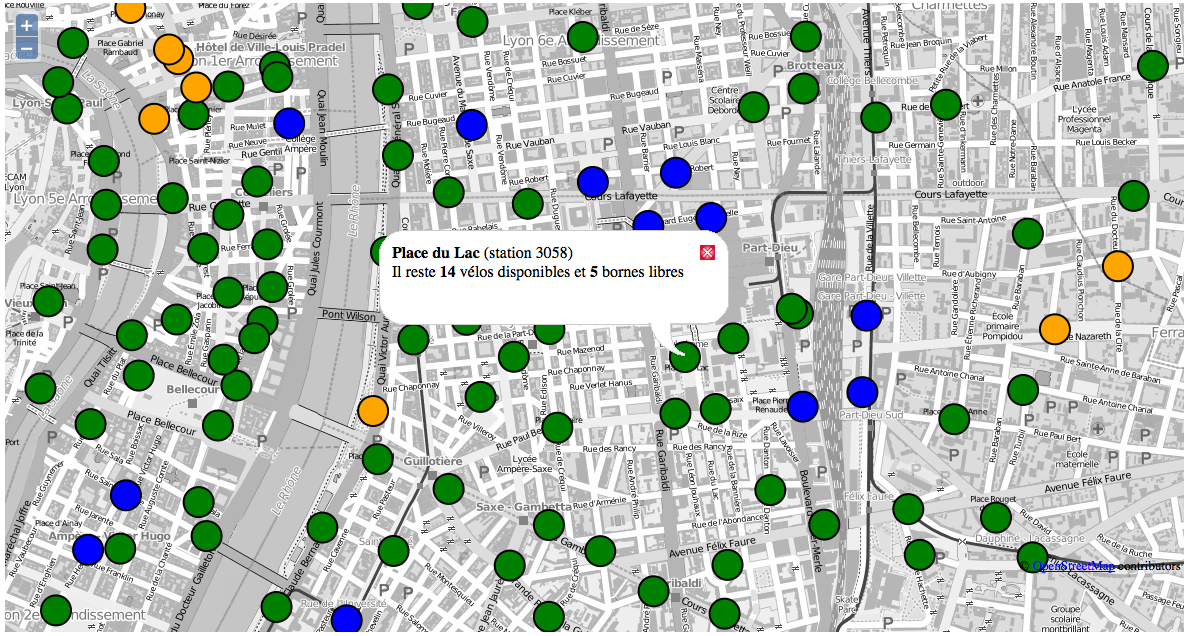
WFS with OpenLayers
This example shows the usage of the WFS service for real time bike stands availability using the OpenLayers library.
Corresponding snippet :
<html>
  <head>
    <title>GrandLyon Data services usage : OpenLayers</title>
    <script src="http://openlayers.org/api/OpenLayers.js"></script>
  </head>
    <body>
      <div style="width:100%; height:100%" id="map"></div>
      <script defer="defer" type="text/javascript">
        var map = new OpenLayers.Map('map');
        var osm = new OpenLayers.Layer.OSM('Simple OSM Map', null, {
          //on the fly greyscale conversion of OSM base map.
          eventListeners: {
            tileloaded: function(evt) {
              var ctx = evt.tile.getCanvasContext();
              if (ctx) {
                var imgd = ctx.getImageData(0, 0, evt.tile.size.w, evt.tile.size.h);
                var pix = imgd.data;
                for (var i = 0, n = pix.length; i < n; i += 4) {
                  pix[i] = pix[i + 1] = pix[i + 2] = (3 * pix[i] + 4 * pix[i + 1] + pix[i + 2]) / 8;
                }
                ctx.putImageData(imgd, 0, 0);
                evt.tile.imgDiv.removeAttribute("crossorigin");
                evt.tile.imgDiv.src = ctx.canvas.toDataURL();
              }
            }
          }
        });
        //Data service URL
        var data_url = "https://data.grandlyon.com/geoserver/wfs?";
        //Proxy definition for cross-domain handling. Please refer to the Good Practices -> Proxyfication section for more information.
        OpenLayers.ProxyHost = "/cgi-bin/proxy.cgi?url=";

        //Styles for rendering
        var colors = ["green", "blue", "orange", "grey"];
        var context = {
            getColor: function(feature) {
                return colors[feature.data.availabilitycode - 1];
            }
        }
        var template = {
          pointRadius: 15,
          fillColor: "${getColor}" // using context.getColor(feature)
        };
        var style = new OpenLayers.Style(template, {context: context});

        //WFS layer definition
        var wfs = new OpenLayers.Layer.Vector("WFS GL Data", {
            strategies: [new OpenLayers.Strategy.BBOX()],
            protocol: new OpenLayers.Protocol.WFS({
                version: "1.1.0",
                srsName: "EPSG:4326",
                url: data_url,
                featurePrefix : 'ms',
                featureType: "jcd_jcdecaux.jcdvelov",
                geometryName: "msGeometry",
                formatOptions: {
                  xy: false
                }
            }),
            styleMap: new OpenLayers.StyleMap(style),
            renderers: OpenLayers.Layer.Vector.prototype.renderers
        });

        //gestion du click sur les markers
        var selectControl = new OpenLayers.Control.SelectFeature(wfs);
        map.addControl(selectControl);
        selectControl.activate();

        wfs.events.on({
          featureselected: function(event) {
            var feature = event.feature;
            feature.popup = new OpenLayers.Popup.FramedCloud("box",
                feature.geometry.getBounds().getCenterLonLat(),
                null,
                '<div><b>'+feature.data.name + '</b> (station '+feature.data.number+')<br/>'
                + 'There are <b>' + feature.data.available_bikes + '</b> available bikes and '
                + '<b>' + feature.data.available_bike_stands + ' </b>free stands</div>',
                null,
                true
            );
            while( map.popups.length ) {
                map.removePopup( map.popups[0] );
            }
            map.addPopup(feature.popup);
            }
        });

        //Config de la map
        map.addLayers([osm, wfs]);
        var zoom = 15;
        var lonLat = new OpenLayers.LonLat(4.85,45.76);
        map.setCenter(
            lonLat.transform(
                new OpenLayers.Projection("EPSG:4326"),
                map.getProjectionObject()
            ), zoom
        );

        </script>
    </body>
</html>
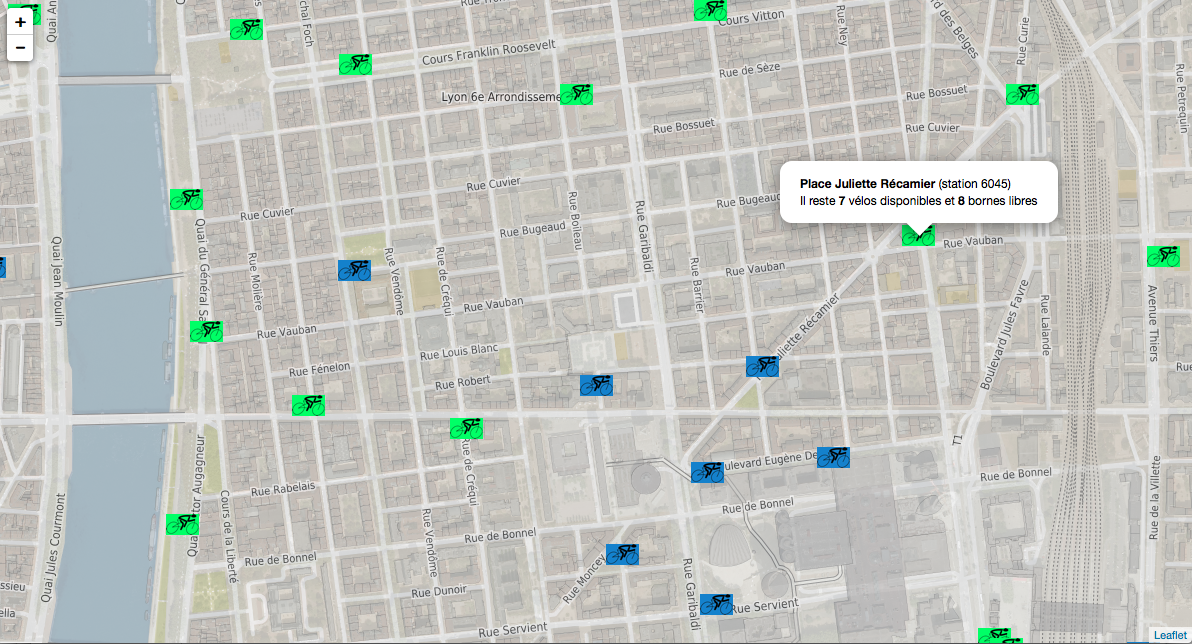
WFS with Leaflet
This example shows the use of the WFS service of real time bike stands with the Leaflet library.
Corresponding source code :
<html>
  <head>
    <title>Usage of GrandLyon data services : Leaflet</title>
    <meta charset="utf-8" />

    <meta name="viewport" content="width=device-width, initial-scale=1.0">

    <script src="http://code.jquery.com/jquery-1.10.2.min.js"></script>
    <script src="https://unpkg.com/leaflet@1.0.1/dist/leaflet.js"></script>
    <link rel="stylesheet" href="https://unpkg.com/leaflet@1.0.1/dist/leaflet.css" />

    <link rel="stylesheet" href="leaflet.css" />
    <style>
        body {
                padding: 0;
                margin: 0;
        }
        html, body, #map {
                height: 100%;
        }
    </style>
  </head>
  <body>
    <div id="map"></div>
    <script>
        //Initialisation de la map
        var map = L.map('map').setView([45.76, 4.85], 14);
        //Layer WMS sur une orthophoto
        L.tileLayer.wms("https://data.grandlyon.com/geoserver/wms",{
                layers: '1840_5175_16_CC46',
                format: 'image/png',
                transparent: true,
                opacity: 0.6
        }).addTo(map);
        //Layer WMS openstreetmap
        L.tileLayer.wms("https://openstreetmap.data.grandlyon.com/",{
                layers: 'osm_grandlyon',
                format: 'image/png',
                transparent: true,
                opacity: 0.7
        }).addTo(map);

        //Proxy definition for cross-domain handling. Please refer to the Good Practices -> Proxyfication section for more information.
                    var proxy = "proxy.php?url=";
        var data_url = "https://data.grandlyon.com/geoserver/wfs";
        var params = '?SERVICE=WFS
            &REQUEST=GetFeature
            &VERSION=1.1.0
            &TYPENAME=jcd_jcdecaux.jcdvelov
            &outputformat=geojson';

        var VertIcon = L.icon({
            iconUrl: 'images/cycling_Vert.png',
            iconSize:     [33, 21]
        });
        var OrangeIcon = L.icon({
            iconUrl: 'images/cycling_Orange.png',
            iconSize:     [33, 21]
        });
        var BleuIcon = L.icon({
            iconUrl: 'images/cycling_Bleu.png',
            iconSize:     [33, 21]
        });
        var GrisIcon = L.icon({
            iconUrl: 'images/cycling_Gris.png',
            iconSize:     [33, 21]
        });

        $.get(proxy + encodeURIComponent(data_url + params), function(json){
            var obj = $.parseJSON(json);
            // Add markers
            for(i=0;i<obj.features.length;i++) {
                //create feature from json
                var ftr = obj.features[i];
                // set marker options from properties
                var options = {
                    gid: ftr.properties.gid,
                    number: ftr.properties.number,
                    name: ftr.properties.name,
                    available_bikes: ftr.properties.available_bikes,
                    available_bike_stands: ftr.properties.available_bike_stands
                };
                //set marker icon from availability
                switch(ftr.properties.availability){
                    case 'Vert':
                        options.icon = VertIcon;
                        break;
                    case 'Orange':
                        options.icon = OrangeIcon;
                        break;
                    case 'Bleu' :
                        options.icon = BleuIcon;
                        break;
                    default :
                        options.icon = GrisIcon;
                }
                //ajout du marker à la map
                var point = L.marker(
                    [ftr.geometry.coordinates[1],ftr.geometry.coordinates[0]],
                    options
                ).addTo(map);
                //popup on click settings
                point.bindPopup(
                    '<b>'+ point.options.name + '</b> (station '+point.options.number+')<br/>'
                    + 'There are <b>' + point.options.available_bikes + '</b> available bikes'
                    + ' and <b>' + point.options.available_bike_stands + ' </b> free stands',
                    {
                    closeButton: false
                    }
                );

            }
        });

        </script>
    </body>
</html>
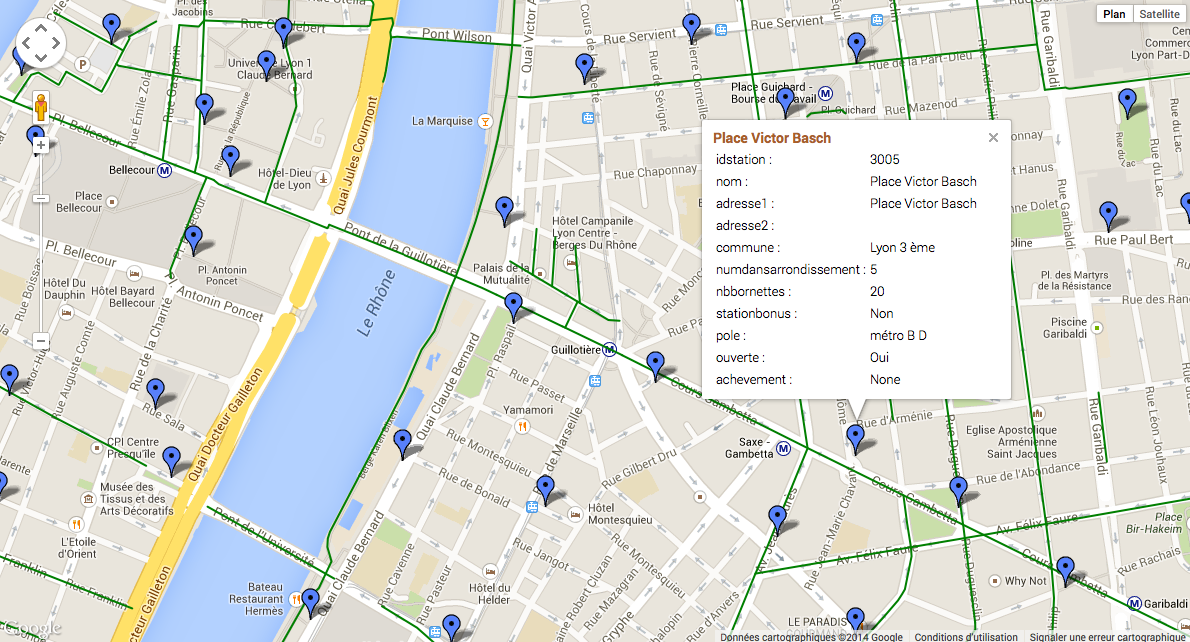
KML with GoogleMaps API
This example shows the usage of the KML service of real-time bike stands monitoring with GoogleMaps API v3. This needs a personal API key.
Corresponding source code :
<html>
  <head>
    <title>Use of GrandLyon Data Services : Google API</title>
    <meta name="viewport" content="initial-scale=1.0, user-scalable=no" />
    <style type="text/css">
      html { height: 100% }
      body { height: 100%; margin: 0; padding: 0 }
      #map-canvas { height: 100% }
    </style>
    <script type="text/javascript"
        src="https://maps.googleapis.com/maps/api/js?key=API_KEY&sensor=false">
    </script>

    <script type="text/javascript">
      function initialize() {
        //Init map
        var mapOptions = {
          center: new google.maps.LatLng(45.76, 4.85),
          zoom: 13
        };
        var map = new google.maps.Map(document.getElementById("map-canvas"),
            mapOptions);

        //Adding of Cycling facilities WMS stream.
        var urlWMS = "https://download.data.grandlyon.com/wms/grandlyon?"
                + "&REQUEST=GetMap&SERVICE=WMS&VERSION=1.3.0&CRS=EPSG:4171"
                + "&LAYERS=pvo_patrimoine_voirie.pvoamenagementcyclable"
                + "&FORMAT=image/png&TRANSPARENT=TRUE&WIDTH=256&HEIGHT=256";
        //Google Map API doesn't handle directly the WMS, we need to use an ImageMapType object
        var WMS_Layer = new google.maps.ImageMapType({
            getTileUrl: function (coord, zoom) {
                var projection = map.getProjection();
                var zoomfactor = Math.pow(2, zoom);
                var LL_upperleft = projection.fromPointToLatLng(
                    new google.maps.Point(
                        coord.x * 256 / zoomfactor,
                        coord.y * 256 / zoomfactor
                    )
                );
                var LL_lowerRight = projection.fromPointToLatLng(
                    new google.maps.Point(
                        (coord.x + 1) * 256 / zoomfactor,
                        (coord.y + 1) * 256 / zoomfactor
                    )
                );
                var bbox =  "&bbox="
                    + LL_lowerRight.lat() + "," + LL_upperleft.lng() + ","
                    + LL_upperleft.lat() + "," + LL_lowerRight.lng();
                var url = urlWMS + bbox;
                return url;
            },
            tileSize: new google.maps.Size(256, 256),
            isPng: true
        });

        map.overlayMapTypes.push(WMS_Layer);

        //Ajout KML layer
        var KML_Layer = new google.maps.KmlLayer({
          url: 'https://data.grandlyon.com/geoserver/ows?SERVICE=WFS&VERSION=2.0.0&request=GetFeature&typename=sytral:tcl_sytral.tcllignebus_2_0_0&outputFormat=kml&SRSNAME=EPSG:4171&sortBy=gid'
        });
        KML_Layer.setMap(map);

      }
      google.maps.event.addDomListener(window, 'load', initialize);
    </script>

  </head>
  <body>
    <div id="map-canvas"/>
  </body>
</html>
WCS examples
This example shows the usage of a WCS service to retrieve NO2 raw data for 2012 across the Grand Lyon territory. In this example, we will use the server 2.0.1 of standard, which is the most recent. But it is also possible to use 1.1.1 or even 1.0.0 versions.
Step 1 : getting the service capabilities
https://data.grandlyon.com/wcs?SERVICE=WCS&REQUEST=GetCapabilities&VERSION=2.0.1
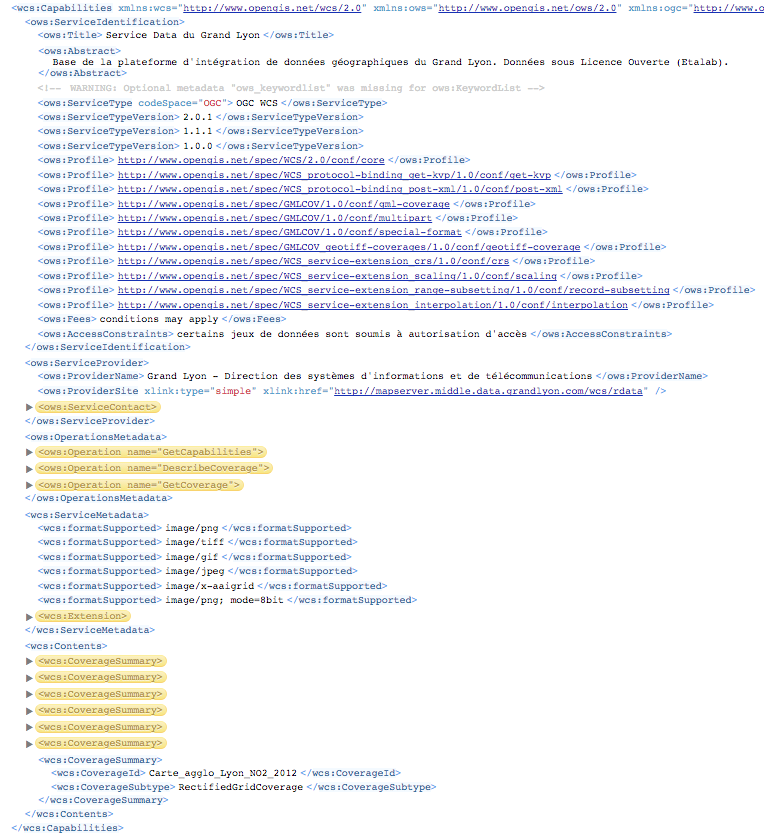
Among the received information, one can discover the available output formats. WCS is a kind of service designed to provide raw data. Thus it is recommanded to use it with an output format able to handle full image definition, like image/x-aaigrid for monoband images or image/tiff for a multi-spectral raster file rather than the visualization output formats that are image/jpeg or image/gif.
In the last part of the returned XML document, we find the coverage list available from the service, and as part of it the grandlyon:sTFONS_Step_02cm_2018 coverage we will be using in the rest of this example.
Step 2 : Coverages details
Caution ! In the 2.0.1 version, the parameter used to indicate the requested coverage is COVERAGEID, but in version 1.0 it’s IDENTIFIER and in version 1.1, it’s COVERAGE. Yes, it’s a lot of fun and provdes a lot a work for consultants.
Beware the coverage name case as well if you are manually testing the requests from a web browser : the WCS service is case sensitive. That way, the grandlyon:sTFONS_Step_02cm_2018 coverage (with lower case ‘l’) won’t be found by the service.
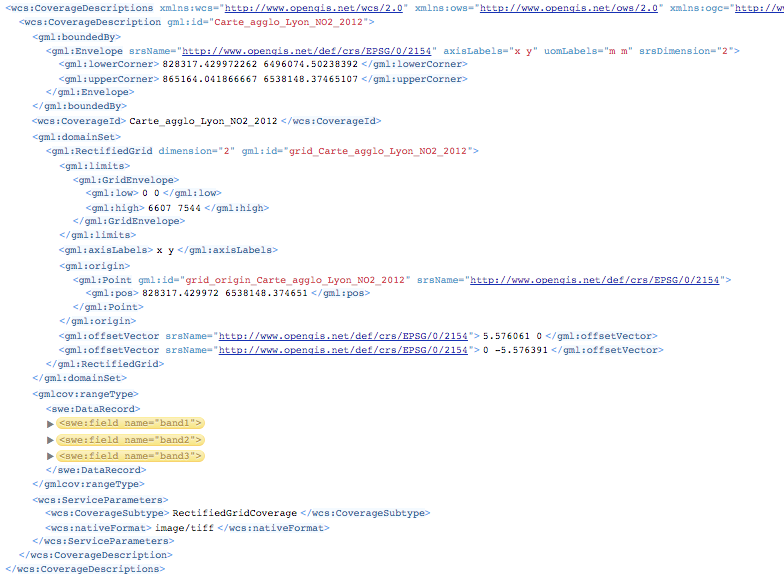
This request lets you retrieve all the details of the specified coverage, like the geographic extent or information about the different bands. It shows clearly the data source we are requesting is a 3 band multi-spectral image.
Step 3 : obtention de la couverture
The following request lets you retrieve a sample of the original raster image in TIFF format :
CSW Service usage
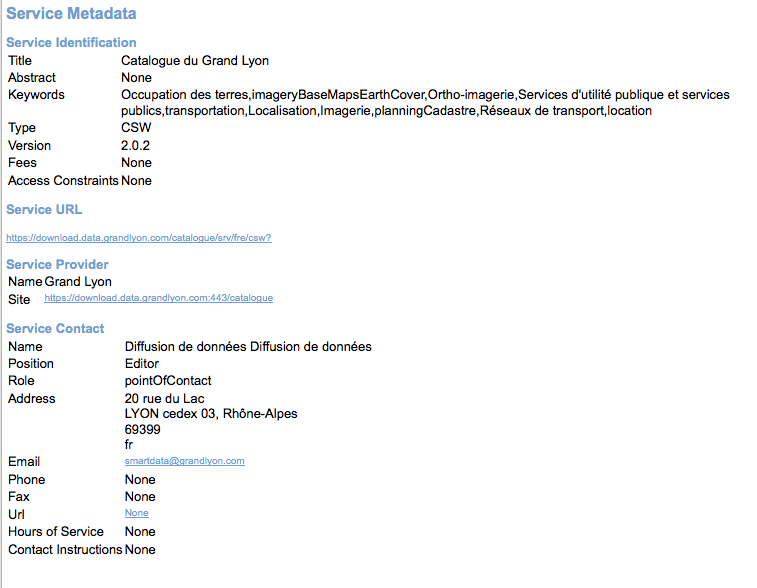
This example illustrates the usage of a CSW service to get information about the metadata.
Step 1 : Service capacities reading
https://data.grandlyon.com/geonetwork/srv/fre/csw?version=2.0.2&request=GetCapabilities&service=CSW
XML document rendering example (from QGIS CSW plugin):
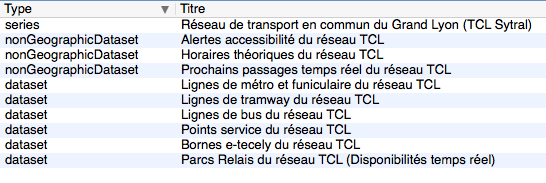
Step 2 : Query with keywords (transport here)
POST request : https://data.grandlyon.com/geonetwork/srv/fre/csw with XML data embedded in the POST body :
<?xml version="1.0" ?>
<csw:GetRecords maxRecords="10" outputFormat="application/xml" outputSchema="http://www.opengis.net/cat/csw/2.0.2" resultType="results" service="CSW" version="2.0.2" xmlns:csw="http://www.opengis.net/cat/csw/2.0.2" xmlns:ogc="http://www.opengis.net/ogc" xmlns:xsi="http://www.w3.org/2001/XMLSchema-instance" xsi:schemaLocation="http://www.opengis.net/cat/csw/2.0.2 http://schemas.opengis.net/csw/2.0.2/CSW-discovery.xsd">
        <csw:Query typeNames="csw:Record">
                <csw:ElementSetName>full</csw:ElementSetName>
                <csw:Constraint version="1.1.0">
                        <ogc:Filter>
                                <ogc:PropertyIsLike escapeChar="\" singleChar="_" wildCard="%">
                                        <ogc:PropertyName>csw:AnyText</ogc:PropertyName>
                                        <ogc:Literal>Réseaux de transport</ogc:Literal>
                                </ogc:PropertyIsLike>
                        </ogc:Filter>
                </csw:Constraint>
        </csw:Query>
</csw:GetRecords>
XML response abstract :
<?xml version="1.0" encoding="UTF-8"?>
<csw:GetRecordsResponse xmlns:csw="http://www.opengis.net/cat/csw/2.0.2" xmlns:xsi="http://www.w3.org/2001/XMLSchema-instance" xsi:schemaLocation="http://www.opengis.net/cat/csw/2.0.2 http://schemas.opengis.net/csw/2.0.2/CSW-discovery.xsd">
<csw:SearchStatus timestamp="2015-11-06T16:36:24" />
<csw:SearchResults numberOfRecordsMatched="47" numberOfRecordsReturned="10" elementSet="full" nextRecord="11">
<csw:Record xmlns:ows="http://www.opengis.net/ows" xmlns:geonet="http://www.fao.org/geonetwork" xmlns:dc="http://purl.org/dc/elements/1.1/">
<dc:title xmlns:dct="http://purl.org/dc/terms/">Alertes accessibilité du réseau TCL</dc:title>
<dc:creator xmlns:dct="http://purl.org/dc/terms/">256900994</dc:creator>
<dc:subject xmlns:dct="http://purl.org/dc/terms/">Réseaux de transport</dc:subject>
<dc:subject xmlns:dct="http://purl.org/dc/terms/">Services d'utilité publique et services publics</dc:subject>
<dc:description xmlns:dct="http://purl.org/dc/terms/">Les alertes accessibilité recensent les ascenseurs et escaliers mécaniques actuellement indisponibles dans les stations de métro et de tramway équipées du réseau TCL.</dc:description>
<dc:publisher xmlns:dct="http://purl.org/dc/terms/">SYTRAL</dc:publisher>
<dc:type xmlns:dct="http://purl.org/dc/terms/">nonGeographicDataset</dc:type>
<dc:format xmlns:dct="http://purl.org/dc/terms/">application/json</dc:format>
<dc:format xmlns:dct="http://purl.org/dc/terms/">text/csv</dc:format>
<dc:format xmlns:dct="http://purl.org/dc/terms/">csv (taille : 2 Ko)</dc:format>
<dc:source xmlns:dct="http://purl.org/dc/terms/">Données provenant de la base géographique et topologique TCL SYTRAL.</dc:source>
<dc:language xmlns:dct="http://purl.org/dc/terms/">fre</dc:language>
<dc:relation xmlns:dct="http://purl.org/dc/terms/">https://download.data.grandlyon.com/ws/rdata/tcl_sytral.tclalerteaccessibilite/all.json</dc:relation>
<dc:relation xmlns:dct="http://purl.org/dc/terms/">https://download.data.grandlyon.com/files/rdata/tcl_sytral.tclalerteaccessibilite/alerte_accessibilite.csv</dc:relation>
<dc:relation xmlns:dct="http://purl.org/dc/terms/">https://download.data.grandlyon.com/files/grandlyon/LicenceEngagee.pdf</dc:relation>
<dc:coverage xmlns:dct="http://purl.org/dc/terms/">North 45.917, South 45.55, East 5.067, West 4.681. GRAND LYON</dc:coverage>
<dc:rights xmlns:dct="http://purl.org/dc/terms/">Licence Engagée</dc:rights>
<dc:rights xmlns:dct="http://purl.org/dc/terms/">Pas de restriction d'accès public selon INSPIRE</dc:rights>
<dct:created xmlns:dct="http://purl.org/dc/terms/">2014-12-04</dct:created>
<dct:dateSubmitted xmlns:dct="http://purl.org/dc/terms/">2015-02-02</dct:dateSubmitted>
<dct:isPartOf xmlns:dct="http://purl.org/dc/terms/">16a9a657-e938-484e-a067-5cdacd7a0419</dct:isPartOf>
<dct:accessRights xmlns:dct="http://purl.org/dc/terms/">Free access with registration</dct:accessRights>
<dct:accrualPeriodicity xmlns:dct="http://purl.org/dc/terms/">continuous</dct:accrualPeriodicity>
<dct:modified xmlns:dct="http://purl.org/dc/terms/">2015-11-06T00:02:26</dct:modified>
<dc:identifier xmlns:dct="http://purl.org/dc/terms/">4721ec9e-86c8-4687-8713-f406290949ad</dc:identifier>
<ows:BoundingBox crs="urn:x-ogc:def:crs:EPSG:6.11:4326">
<ows:LowerCorner>45.55 4.681</ows:LowerCorner>
<ows:UpperCorner>45.917 5.067</ows:UpperCorner>
</ows:BoundingBox>
</csw:Record>
<csw:Record xmlns:ows="http://www.opengis.net/ows" xmlns:geonet="http://www.fao.org/geonetwork" xmlns:dc="http://purl.org/dc/elements/1.1/" xmlns:dct="http://purl.org/dc/terms/">
<dc:identifier>58f93af3-a651-4cbd-bd9d-b4562f8d404d</dc:identifier>
<dc:date>2015-11-06T00:04:55</dc:date>
<dc:title>Lignes de métro et funiculaire du réseau TCL</dc:title>
<dc:type>dataset</dc:type>
<dc:subject>Réseaux de transport</dc:subject>
<dc:subject>Services d'utilité publique et services publics</dc:subject>
<dc:subject>transportation</dc:subject>
<dc:format />
<dct:abstract>La représentation graphique des lignes de métro et de funiculaire du réseau TCL est un objet linéaire qui localise la ligne et son parcours de terminus à terminus.
La représentation graphique des lignes est caractérisée par des informations de gestion (identifiant, numéro de ligne et sens, libellé, unité de transport, couleur du tracé, famille de transport) et de tracés (polylignes de terminus à terminus).</dct:abstract>
<dc:description>La représentation graphique des lignes de métro et de funiculaire du réseau TCL est un objet linéaire qui localise la ligne et son parcours de terminus à terminus.
La représentation graphique des lignes est caractérisée par des informations de gestion (identifiant, numéro de ligne et sens, libellé, unité de transport, couleur du tracé, famille de transport) et de tracés (polylignes de terminus à terminus).</dc:description>
<dc:rights>license</dc:rights>
<dc:language>fre</dc:language>
<dc:source>Données provenant de la base géographique et topologique TCL SYTRAL.</dc:source>
<dc:relation>16a9a657-e938-484e-a067-5cdacd7a0419</dc:relation>
<dc:format />
<ows:BoundingBox crs="urn:ogc:def:crs:EPSG::RGF93 / CC46 (EPSG:3946)">
<ows:LowerCorner>5.1410943067093 45.486705557736</ows:LowerCorner>
<ows:UpperCorner>4.629545313738 45.945335689366</ows:UpperCorner>
</ows:BoundingBox>
<dc:URI protocol="DB:POSTGIS" name="tcl_sytral.tcllignemf" description="Lignes de métro et funiculaire du réseau TCL">jdbc:postgresql://postgis_tr:5432/grandlyon:$gl69@rdata</dc:URI>
<dc:URI protocol="OGC:WMS" name="tcl_sytral.tcllignemf" description="Lignes de métro et funiculaire du réseau TCL (OGC:WMS)">https://download.data.grandlyon.com/wms/rdata</dc:URI>
<dc:URI protocol="OGC:WFS" name="tcl_sytral.tcllignemf" description="Lignes de métro et funiculaire du réseau TCL (OGC:WFS)">https://download.data.grandlyon.com/wfs/rdata</dc:URI>
<dc:URI protocol="WWW:LINK-1.0-http--link" name="tcl_sytral.tcllignemf/all.json" description="Description des données dans le format texte JSON">https://download.data.grandlyon.com/ws/rdata/tcl_sytral.tcllignemf/all.json</dc:URI>
<dc:URI protocol="WWW:LINK-1.0-http--link" name="Licence Ouverte" description="Description des conditions d'utilisation de la Licence Ouverte">https://download.data.grandlyon.com/files/grandlyon/LicenceOuverte.pdf</dc:URI>
<dc:URI protocol="image/png" name="thumbnail">https://download.data.grandlyon.com/catalogue/srv/fre/resources.get?uuid=58f93af3-a651-4cbd-bd9d-b4562f8d404d&fname=funimetrotrac_s.png</dc:URI>
<dc:URI protocol="image/png" name="large_thumbnail">https://download.data.grandlyon.com/catalogue/srv/fre/resources.get?uuid=58f93af3-a651-4cbd-bd9d-b4562f8d404d&fname=funimetrotrac.png</dc:URI>
</csw:Record>
<csw:Record xmlns:ows="http://www.opengis.net/ows" xmlns:geonet="http://www.fao.org/geonetwork" xmlns:dc="http://purl.org/dc/elements/1.1/">
...
</csw:Record>
</csw:SearchResults>
</csw:GetRecordsResponse>
Result presentation example (CSW plugin in QGIS) :
Step 3 : Query with keywords and a geographic extent.
POST request : https://data.grandlyon.com/geonetwork/srv/fre/csw with POST data :
<?xml version="1.0" ?>
<csw:GetRecords maxRecords="10" outputFormat="application/xml" outputSchema="http://www.opengis.net/cat/csw/2.0.2" resultType="results" service="CSW" version="2.0.2" xmlns:csw="http://www.opengis.net/cat/csw/2.0.2" xmlns:gml311="http://www.opengis.net/gml" xmlns:ogc="http://www.opengis.net/ogc" xmlns:xsi="http://www.w3.org/2001/XMLSchema-instance" xsi:schemaLocation="http://www.opengis.net/cat/csw/2.0.2 http://schemas.opengis.net/csw/2.0.2/CSW-discovery.xsd">
        <csw:Query typeNames="csw:Record">
                <csw:ElementSetName>full</csw:ElementSetName>
                <csw:Constraint version="1.1.0">
                        <ogc:Filter>
                                <ogc:And>
                                        <ogc:BBOX>
                                                <ogc:PropertyName>ows:BoundingBox</ogc:PropertyName>
                                                <gml311:Envelope>
                                                        <gml311:lowerCorner>4.7027853 45.597999</gml311:lowerCorner>
                                                        <gml311:upperCorner>4.7191596 45.609031</gml311:upperCorner>
                                                </gml311:Envelope>
                                        </ogc:BBOX>
                                        <ogc:PropertyIsLike escapeChar="\" singleChar="_" wildCard="%">
                                                <ogc:PropertyName>csw:AnyText</ogc:PropertyName>
                                                <ogc:Literal>Transport, Bus</ogc:Literal>
                                        </ogc:PropertyIsLike>
                                </ogc:And>
                        </ogc:Filter>
                </csw:Constraint>
        </csw:Query>
</csw:GetRecords>
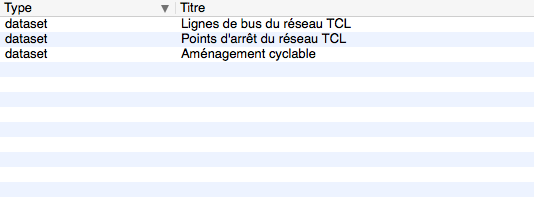
Result presentation example (CSW plugin in QGIS) :
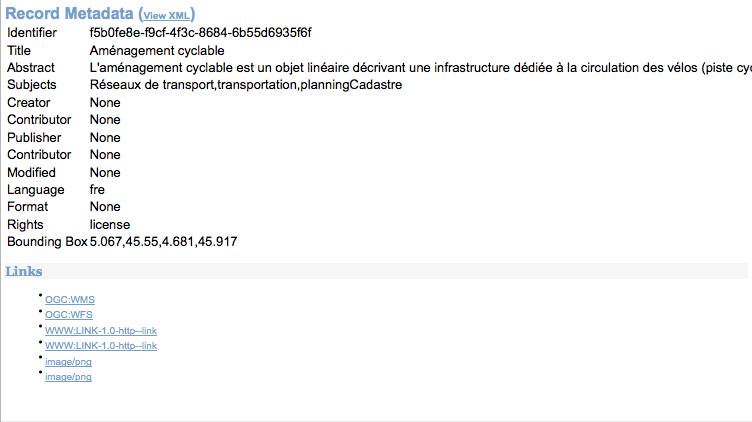
Step 4 : Metadata retrieval from its ID
resulting XML :
<csw:GetRecordByIdResponse xmlns:csw="http://www.opengis.net/cat/csw/2.0.2">
        <csw:Record xmlns:ows="http://www.opengis.net/ows" xmlns:geonet="http://www.fao.org/geonetwork" xmlns:dc="http://purl.org/dc/elements/1.1/" xmlns:dct="http://purl.org/dc/terms/">
                <dc:identifier>f5b0fe8e-f9cf-4f3c-8684-6b55d6935f6f</dc:identifier>
                <dc:date>2015-11-06T00:06:17</dc:date>
                <dc:title>Aménagement cyclable</dc:title>
                <dc:type>dataset</dc:type>
                <dc:subject>Réseaux de transport</dc:subject>
                <dc:subject>transportation</dc:subject>
                <dc:subject>planningCadastre</dc:subject>
                <dc:format/>
                <dct:abstract>
                L'aménagement cyclable est un objet linéaire décrivant une infrastructure dédiée à la circulation des vélos (piste cyclable, bande cyclable, couloir bus ouverte aux vélos, double-sens cyclable, voie verte, mixité en zone de circulation apaisée). Il est caractérisé par des informations de gestion (nom, description, type d'aménagement, année de réalisation ...)
                </dct:abstract>
                <dc:description>
                L'aménagement cyclable est un objet linéaire décrivant une infrastructure dédiée à la circulation des vélos (piste cyclable, bande cyclable, couloir bus ouverte aux vélos, double-sens cyclable, voie verte, mixité en zone de circulation apaisée). Il est caractérisé par des informations de gestion (nom, description, type d'aménagement, année de réalisation ...)
                </dc:description>
                <dc:rights>license</dc:rights>
                <dc:language>fre</dc:language>
                <dc:source>
                Mise à jour en continu : remontée d'informations travaux des services du Grand Lyon et des partenaires et vérification de la donnée sur le terrain.
                </dc:source>
                <dc:format/>
                <ows:BoundingBox crs="urn:ogc:def:crs:EPSG::RGF93 / CC46 (EPSG:3946)">
                        <ows:LowerCorner>5.067 45.55</ows:LowerCorner>
                        <ows:UpperCorner>4.681 45.917</ows:UpperCorner>
                </ows:BoundingBox>
                <dc:URI protocol="OGC:WMS" name="pvo_patrimoine_voirie.pvoamenagementcyclable" description="Aménagement cyclable(OGC:WMS)">https://download.data.grandlyon.com/wms/grandlyon</dc:URI>
                <dc:URI protocol="OGC:WFS" name="pvo_patrimoine_voirie.pvoamenagementcyclable" description="Aménagement cyclable(OGC:WFS)">https://download.data.grandlyon.com/wfs/grandlyon</dc:URI>
                <dc:URI protocol="WWW:LINK-1.0-http--link" name="pvo_patrimoine_voirie.pvoamenagementcyclable/all.json" description="Description des données dans le format texte JSON">
                https://download.data.grandlyon.com/ws/grandlyon/pvo_patrimoine_voirie.pvoamenagementcyclable/all.json
                </dc:URI>
                <dc:URI protocol="WWW:LINK-1.0-http--link" name="Licence Ouverte" description="Description des conditions d'utilisation de la Licence Ouverte">
                https://download.data.grandlyon.com/files/grandlyon/LicenceOuverte.pdf
                </dc:URI>
                <dc:URI protocol="image/png" name="thumbnail">
                https://download.data.grandlyon.com/catalogue/srv/fre/resources.get?uuid=f5b0fe8e-f9cf-4f3c-8684-6b55d6935f6f&fname=DV_AC_s.png
                </dc:URI>
                <dc:URI protocol="image/png" name="large_thumbnail">
                https://download.data.grandlyon.com/catalogue/srv/fre/resources.get?uuid=f5b0fe8e-f9cf-4f3c-8684-6b55d6935f6f&fname=DV_AC.png
                </dc:URI>
        </csw:Record>
</csw:GetRecordByIdResponse>
Result presentation example (CSW plugin in QGIS) :